
Sync Content Campaign — End of Cycle Report
Timeframe: 25/09/2025 – 21/10/2025
Scope: Multi-platform performance across Instagram & TikTok accounts (@qringe y, @estudia_ia, @cringeclub, etc.)
1. Overall Performance
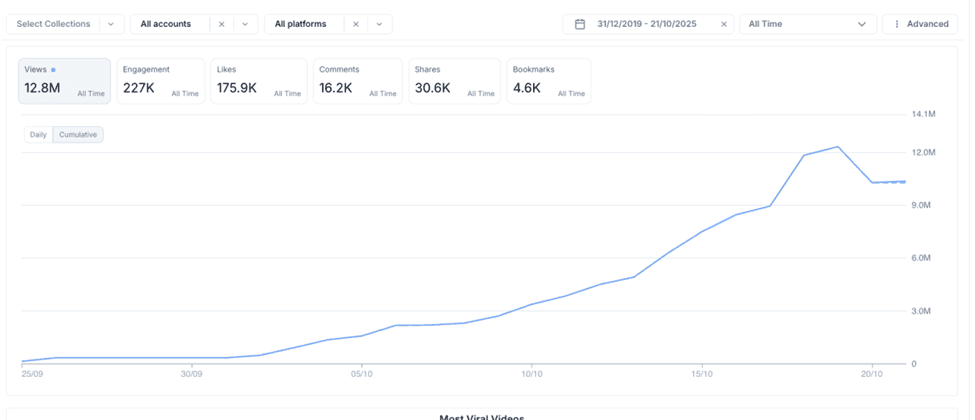
Total Views: 12.8M (All Time)
Engagements: 227K
Likes: 175.9K
Comments: 16.2K
Shares: 30.6K
Bookmarks: 4.6K
The campaign showed steady and consistent growth, peaking around mid-October before stabilizing near 12.8M total views.
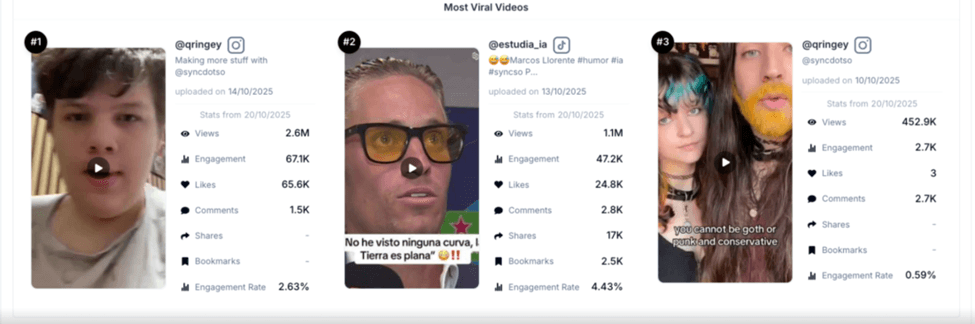
2. Top Performing Videos
Rank | Account | Views | Engagement | Likes | Comments | Engagement Rate |
1 | @qringe y (IG) | 2.6M | 67.1K | 65.6K | 1.5K | 2.63% |
2 | @estudia_ia (TT) | 1.1M | 47.2K | 24.8K | 2.8K | 4.43% |
3 | @qringe y (IG) | 452.9K | 2.7K | 3 | 2.7K | 0.59% |
The @qringe y account consistently led overall reach, while @estudia_ia delivered higher engagement efficiency and stronger virality ratios.
3. 20 Videos Crossed 100K+ Views — A Major Milestone
A total of 20 videos surpassed 100K views, marking a super milestone for the campaign and validating high-performing creative consistency.
Top 5 Among 100K+ Videos
Account | Views | Likes | Comments | ER | Upload Date |
@estudia_ia | 1.1M | 25.3K | 2.8K | 4.4% | 13/10/2025 |
@qringe y | 405.7K | 1.8K | 0 | 0.5% | 13/10/2025 |
@cringeclub | 344.2K | 5.7K | 687 | 1.9% | 13/10/2025 |
@qringe y | 298.3K | 23.8K | 206 | 8.1% | 14/10/2025 |
@estudia_ia | 226.5K | 12.5K | 75 | 8.6% | 09/10/2025 |
Average engagement rate across 100K+ videos: ~4.2%, with top spikes hitting over 13%.
Content tagged with #syncd or #iahumor showed consistent cross-platform virality.
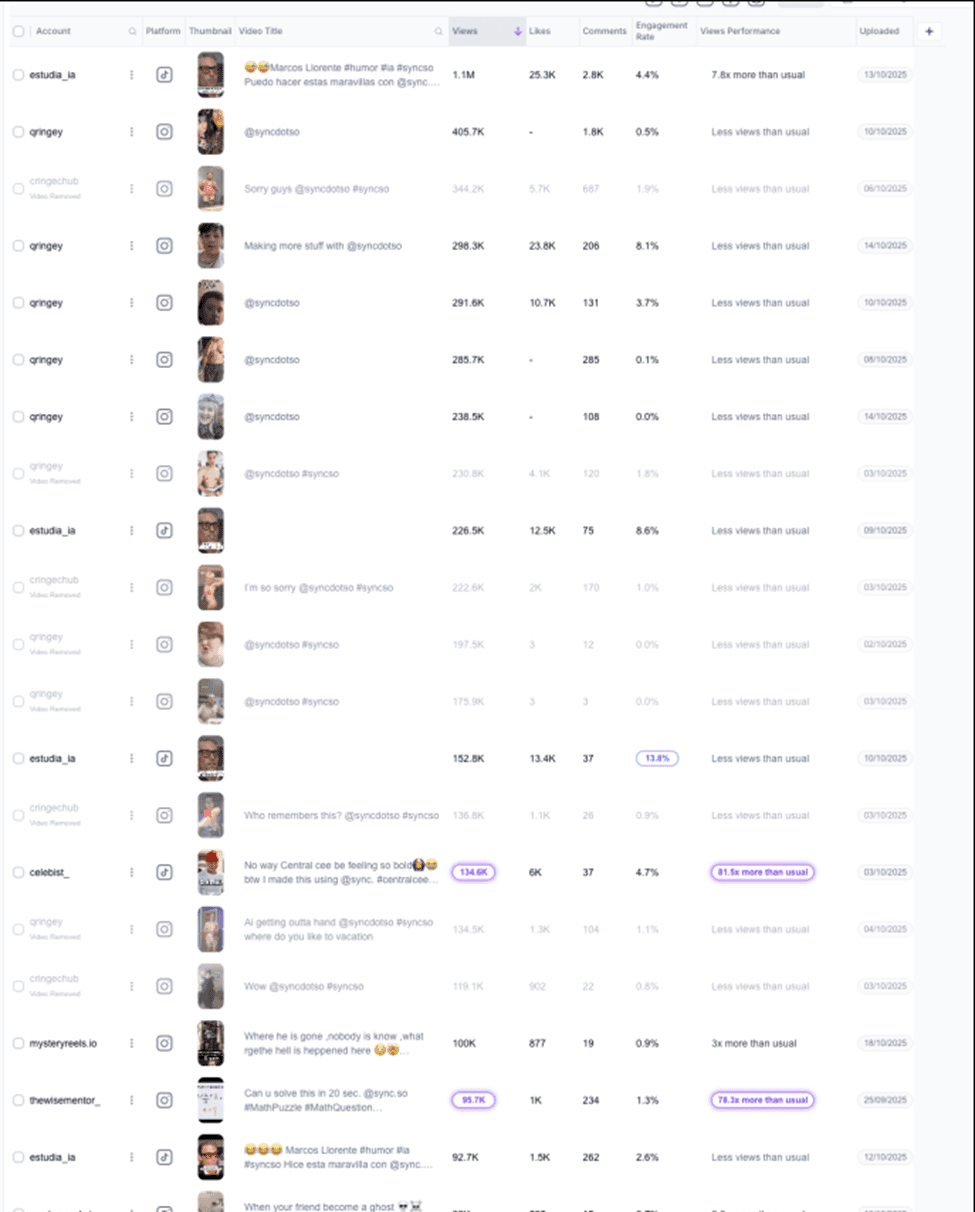
4. Top Video Insights (Extended)
The extended analytics show multiple videos in the 200K–400K view range, indicating broad performance beyond just the top three clips.
Several videos achieved above-average engagement rates (5–13%), reflecting strong audience retention on both humorous and conversational formats.
TikTok videos tended to outperform Instagram in engagement rate, though Instagram maintained higher cumulative reach.
Engagement-heavy videos (4–13% ER) typically featured short dialogue hooks or relatable humor themes — especially those tagged with #syncd or #iahumor.
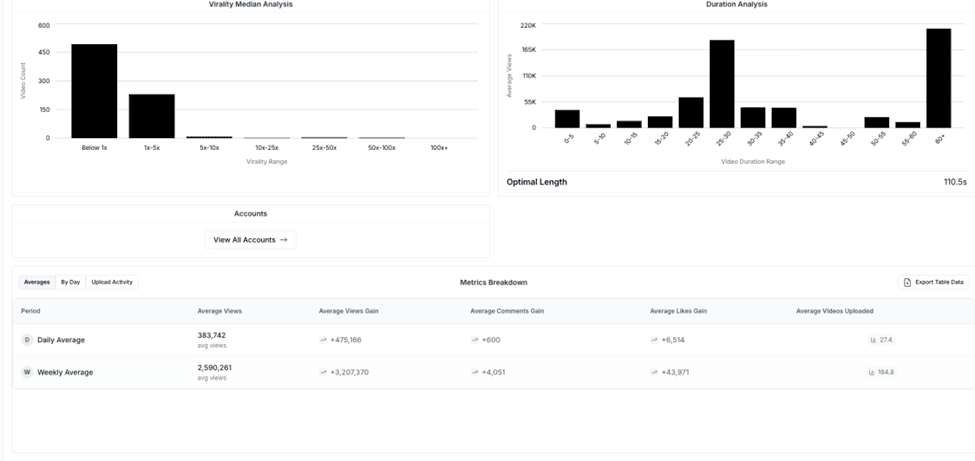
5. Virality & Duration Analysis
Virality Distribution
~500+ videos remained under the 1x baseline.
A smaller group (approx. 200) achieved 1x–5x virality, while a few outliers crossed 10x+.
6. Growth & Activity Breakdown
Metric | Daily Avg | Weekly Avg |
Average Views | 383,742 | 2,590,261 |
Average Views Gain | +475,166 | +3,207,370 |
Average Comments Gain | +600 | +4,051 |
Average Likes Gain | +6,514 | +43,971 |
Uploads | ~27.4/day | ~185/week |
Strong upload frequency and steady engagement growth point to high algorithmic favorability during the campaign’s mid-phase.
7. Key Takeaways
12.8M total views achieved across platforms — a strong indicator of multi-platform synergy.
@qringe y remains the lead driver of total impressions, while @estudia_ia leads in engagement efficiency.
Mid-length clips (20–30s) continue to outperform, both in views and engagement rate.
Sustained upload volume (25–30 videos/day) contributed to consistent visibility and trend adaptation.
8. Next Steps
Double down on mid-length content (20–30 seconds) with strong hooks in the first 3 seconds.
Repurpose the top-performing video formats from @qringe y and @estudia_ia across additional accounts.
Continue leveraging humor and “relatable commentary” trends — proven high-retention categories.
Optimize posting schedules around peak engagement hours identified mid-October.