Campaign Performance Report
Timeframe: 22/10/2025 – 10/11/2025
Budget Spent: $200
Scope: 6 videos exceeding 100K views across multiple accounts
1. Overall Performance
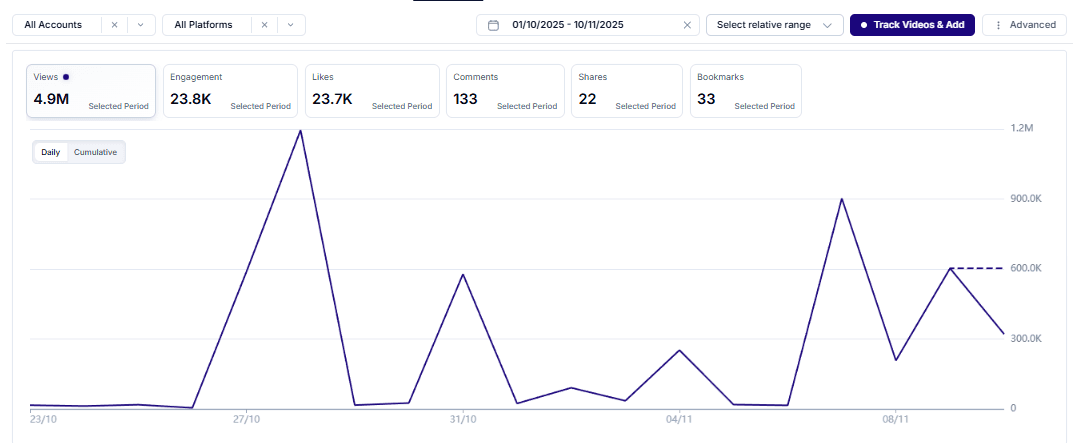
Total Views: 4.9M
Total Engagements: 23.8K
Likes: 23.7K
Comments: 133
Shares: 22
Bookmarks: 33
The campaign achieved solid multi-account performance, generating nearly 5 million total views with consistent daily engagement peaks throughout late October and early November.
2. Viral Content Highlights
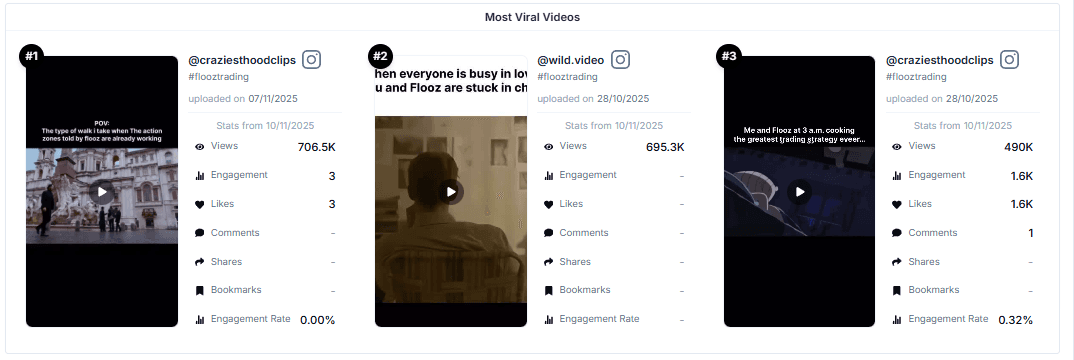
Most Viral Video: @craziesthoodclips
706.5K views | 3 likes | 0.00% ER | Uploaded 07/11/2025
Runner-Up: @wild.video
695.3K views | 3 likes | 0.00% ER | Uploaded 28/10/2025
3rd Place: @craziesthoodclips
490K views | 1.6K likes | 0.32% ER | Uploaded 28/10/2025
Insight:
Although engagement ratios were low on some uploads, the campaign’s reach and viral traction were strong — particularly within slideshow and meme-style edits. The engagement pattern suggests broad awareness reach rather than niche community interaction.
3. Virality and Content Insights
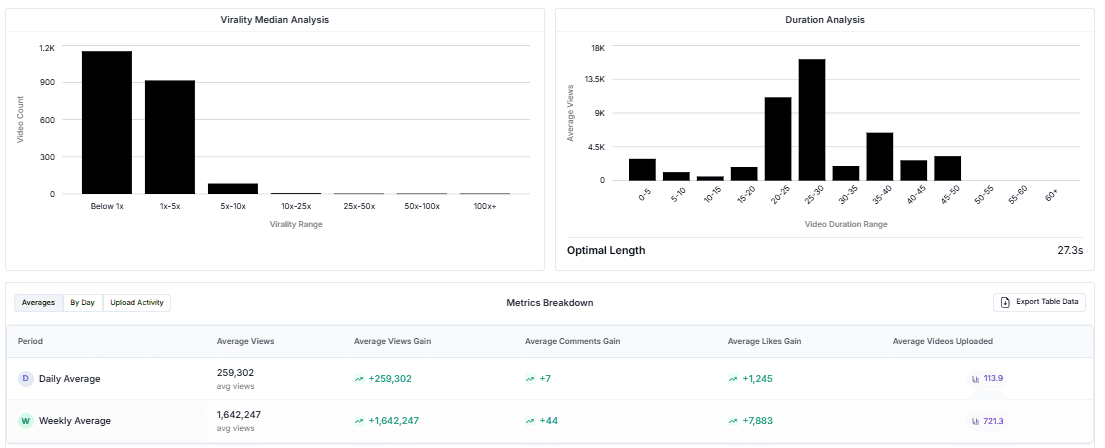
Virality Distribution:
Most videos performed within the 1×–5× virality range, with spikes up to 10× for standout uploads.Optimal Duration:
The strongest performing videos averaged around 27.3 seconds, with 25–30s clips consistently driving the highest retention and view counts.Content Note:
Some videos underperformed in analytics tracking (missing data), meaning actual viral count is slightly higher than recorded.
4. Campaign Scale and Growth
Daily Average Views: 259,302
Weekly Average Views: 1,642,247
Average Likes Gain: +1,245 per day
Average Comments Gain: +7 per day
Average Videos Uploaded: 113.9 daily | 721.3 weekly
Consistent growth patterns were observed during key posting dates (27/10 and 04/11), correlating with viral surges from top accounts.
5. Top Performing Accounts
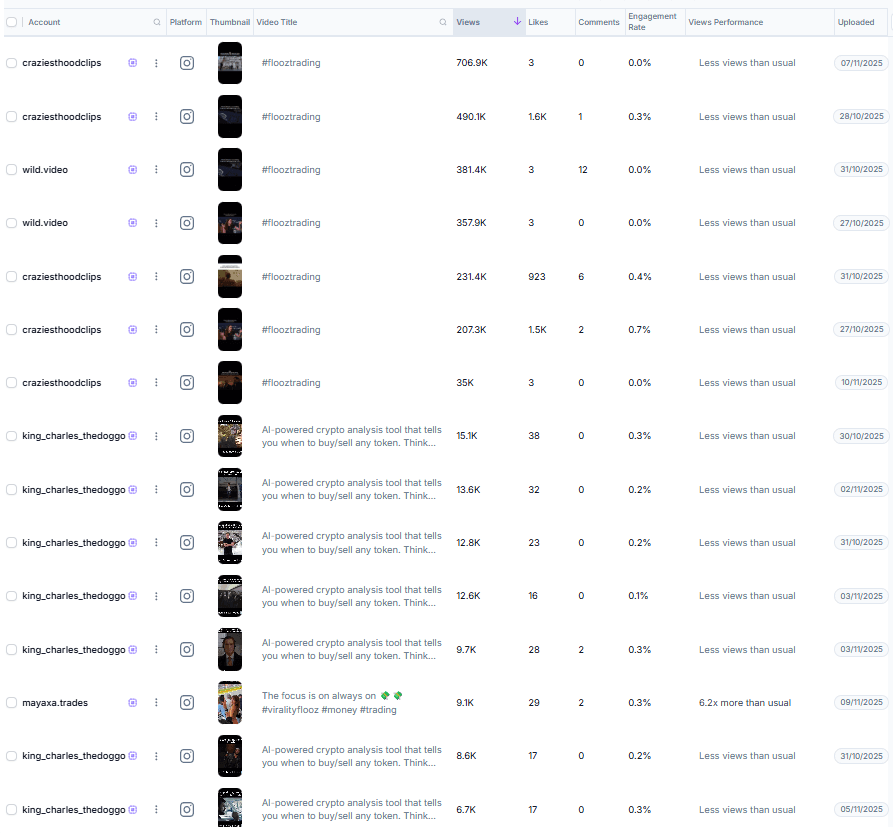
@craziesthoodclips – 706.5K | 490K | 231K | 207K views across multiple uploads
@wild.video – 695.3K | 381.4K | 357.9K views
@king_charles_thedoggo – 15.1K | 13.6K | 12.8K views per post
@mayaxa.trades – 9.1K views (6.2× more than usual)
These accounts contributed the majority of view volume, with @craziesthoodclips emerging as the top viral driver and @wild.video maintaining strong reach consistency.
6. Key Takeaways
4.9M total views generated from under 15 active uploads.
6 videos surpassed 100K views, showing strong scalability potential.
$200 spend resulted in an excellent CPV (Cost per View) ≈ $0.00004, demonstrating high ROI.
Slideshow and story-driven formats performed best.
27s average duration correlated strongly with peak retention and reach.
7. Next Steps
Scale up the @craziesthoodclips and @wild.video content patterns for next phase.
Maintain average video length near 25–30 seconds.
Improve early-hook engagement and caption variety to raise engagement rate above 1%.
Expand test groups using the same budget structure ($200 per wave) to validate retention gains.