Flooz Trading — Campaign Report
Campaign Performance Report
Timeframe: 23/10/2025 – 01/12/2025
Total Budget Spent: $2,800
Scope: Multi-account Instagram Reels campaign across trading, meme, lifestyle, and motivational niches.
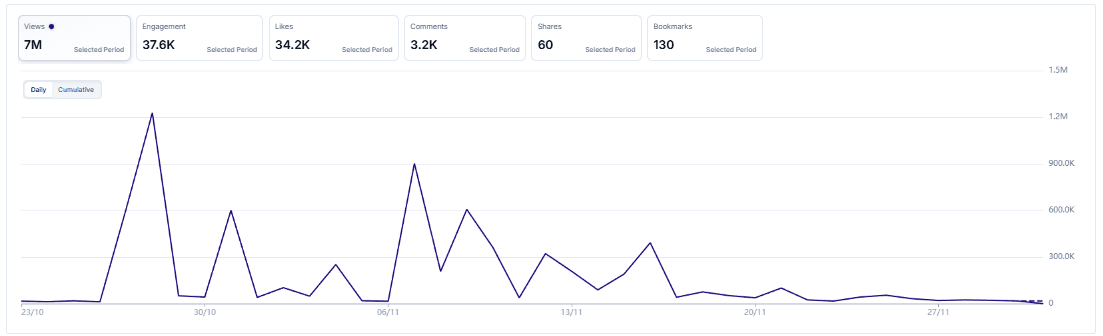
1. Overall Performance
Total Views: 7M
Total Engagements: 37.6K
Likes: 34.2K
Comments: 3.2K
Shares: 60
Bookmarks: 130
Engagement remained healthy throughout the campaign, with several sharp view spikes driven by short-form trading & lifestyle edits.
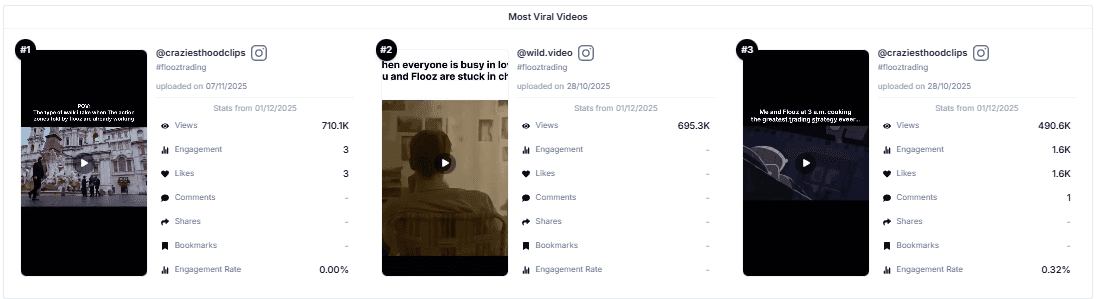
2. Viral Content Highlights (Top 3 Posts)
@craziesthoodclips
710.1K views
3 likes | 3 engagements
Published 07/11/2025
@wild.video
695.3K views
Published 28/10/2025
@craziesthoodclips
490.6K views
1.6K likes | 1 comment
0.32% ER
Published 28/10/2025
These videos formed the core viral push of the campaign, providing over 1.8M+ views combined.
3. Virality, Duration & Performance Insights
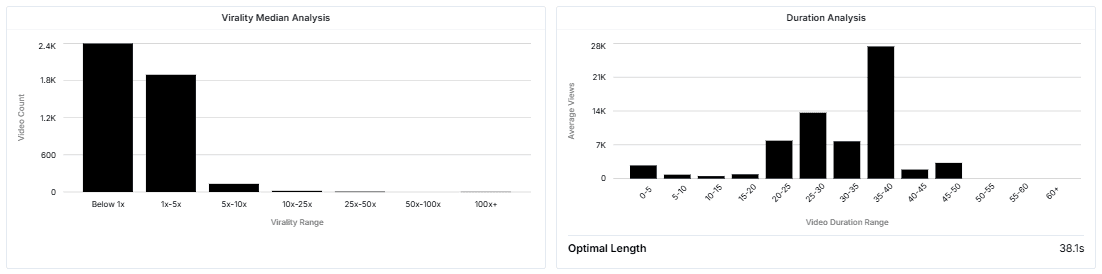
Virality Spread
Majority of videos landed in the <1x virality range (normal for scale campaigns).
A strong cluster appeared in the 1x–5x band.
Outliers in the 5x–10x range contributed meaningfully to total impressions.
Optimal Video Duration
Highest-performing videos fell in the 30–40s range.
The campaign’s optimal average length: 38.1s
Performance clearly improved for mid-length storytelling edits vs. ultra-short memes.
4. Top Performing Accounts
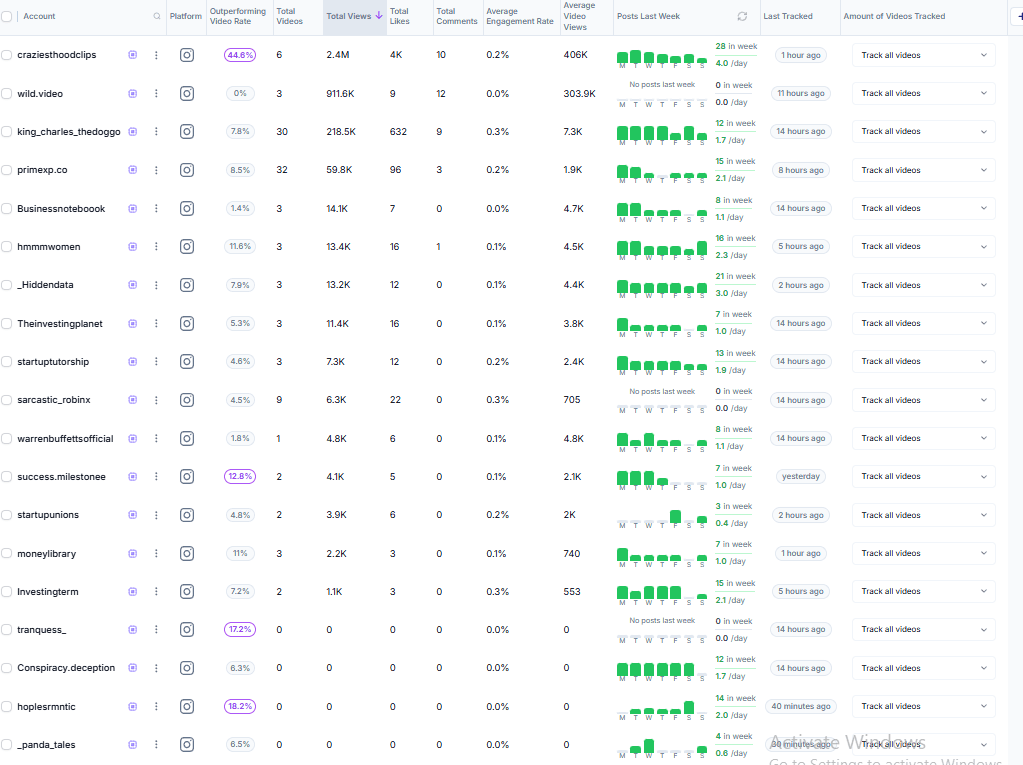
Key account highlights:
@craziesthoodclips — 2.4M total views | 44.6% outperform rate
@wild.video — 911.6K total views
@king_charles_thedoggo — 218.5K views
@Businessnotebook — consistent posting, stable reach
@hmmmwomen, @_Hiddendata, @Theinvestingplanet — steady growth across trading-themed content
Accounts with outperform rates above 10% demonstrated exceptional scalability and strong algorithmic compatibility with Flooz-style edits.
5. Top Performing Videos (Full Video List)
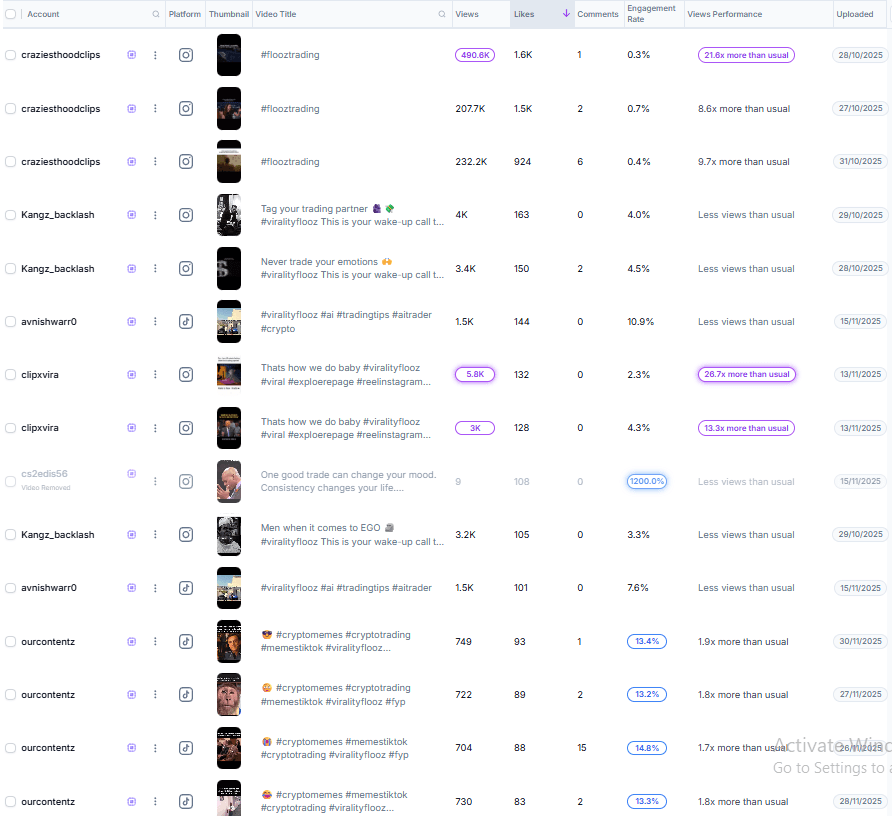
Note: Some videos did not appear in the dashboard export even though they were tracked live — actual high-performers are slightly higher than the list shows.
Key performers include:
490.8K views — @craziesthoodclips
232.2K–207.7K views — multiple uploads from @craziesthoodclips
5.8K & 3K views — @clipxvira (strong outperform % on lower volume content)
Multiple videos delivering 2–10x outperform rates, confirming strong audience-hook alignment.
6. Metrics Breakdown
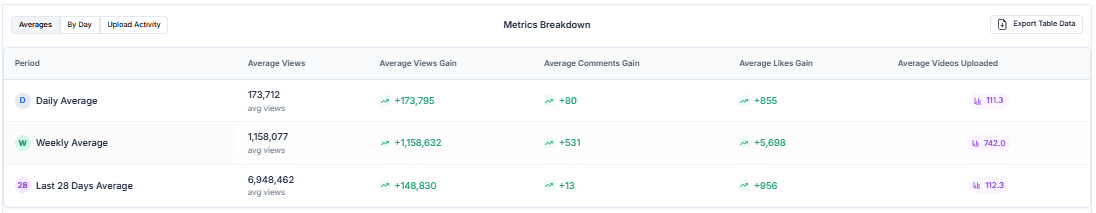
Daily Average
173,712 avg views / day
+173,795 average daily view growth
+855 likes gained daily
~111 videos uploaded/day
Weekly Average
1,158,077 avg views / week
+5,698 likes/week
~742 videos uploaded/week
Last 28 Days
6,948,462 total views
+956 likes on average
~112.3 uploads/day
These metrics indicate excellent consistency, with strong week-to-week stability.
7. Key Takeaways
7M total views generated on a $2,800 budget, delivering highly cost-efficient exposure.
Multiple videos crossed the 200K–700K view range, showing strong viral potential for Flooz content.
Mid-length videos (30–40s) performed best across accounts.
High outperform-rate accounts should be prioritized in future cycles.
Content themes around trading motivation, discipline, lifestyle, and emotional control performed consistently well.
8. Recommendations & Next Steps
Double down on top accounts such as @craziesthoodclips and @wild.video due to proven viral performance.
Shift more content toward the 30–40 second format, which showed the highest view averages.
Introduce new variations of winning formats (motivational + cinematic edits).
Allocate more uploads to accounts with 10–20%+ outperform rates for higher ROI.
Test stronger CTA overlays to increase comments & shares.